
Agents Can Now Draw Charts — and They Show Up Right in Your Email
Ask a monitoring agent “how much email did we send today?” and you used to get a paragraph of numbers. Now you can ask for a chart and get one.
Agents in BotTrottr can draw bar and line charts from the data they collect, and the chart is delivered wherever the result goes: inline in the dashboard console, in run history, and embedded in the result email — no attachment to open, no link to click.
A real example
Here’s the kind of chart our CloudWatch agent produces when you give it the task “Produce a chart for the SES usage today.” (The numbers below are sample data, but the image is rendered by the same code the agent uses.)
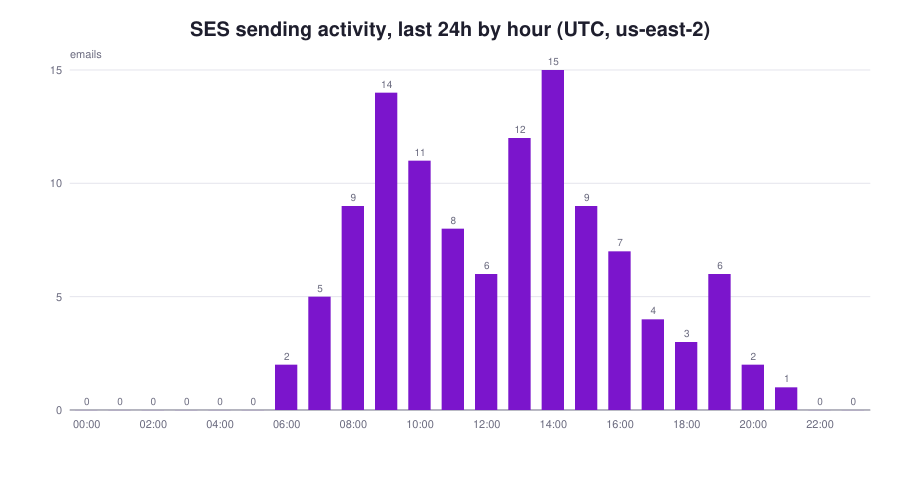
The agent pulled the last 24 hours of Amazon SES sending statistics, grouped them by hour, and drew the bars — with the busy mid-morning and early-afternoon sending windows standing out immediately. If there had been bounces or complaints, they’d appear as extra colored series with a legend.
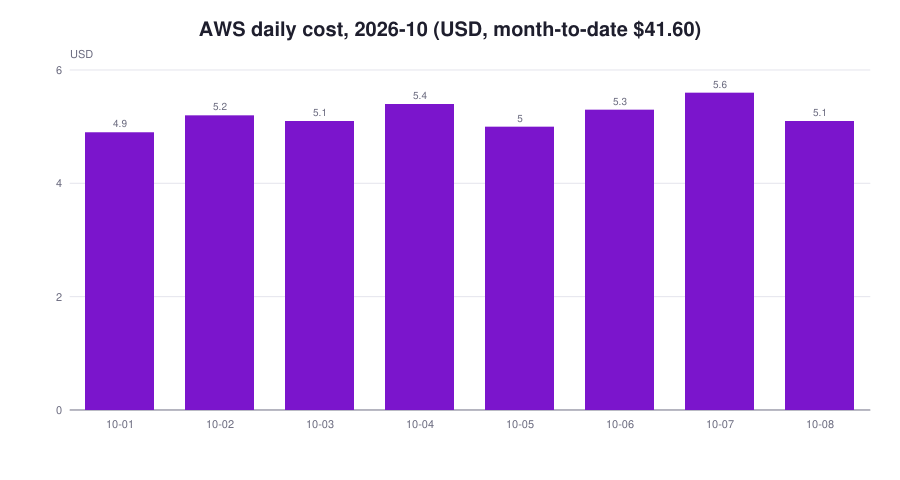
It can do cost too. Ask the same agent to chart your AWS spend and you get daily cost for the month so far:
How it works
There’s no charting service in the loop and no third-party API. The whole thing runs inside BotTrottr:
- The agent gathers data. For AWS agents that’s the SES statistics or Cost Explorer calls; any agent can also hand its own numbers to the chart tool.
- A
createCharttool draws it. The tool takes a title, labels, and one or more series (and abarorlinetype), validates them, and renders a PNG. Colors use the BotTrottr palette, axes get tidy round-number scales, and labels are thinned so they never overlap. - The image is stored and signed. The PNG is saved and given a signed link that only BotTrottr can mint, so charts can’t be guessed or enumerated. (They’re kept for 24 hours.)
- The result carries the image. BotTrottr adds an image marker to the agent’s result, and every surface that shows results already knows how to render it.
That last step is why email works so well. The same result that appears in your console is turned into an HTML email with the chart embedded as a real image — it appears inline right under the agent’s written summary (some email clients ask you to allow remote images the first time).
Two things we had to get right
Models forget. Language models sometimes rewrite their final answer and drop the image line, pasting a bare link instead. So BotTrottr keeps track of every chart an agent creates during a run and re-attaches it if the model leaves it out. If a bare chart link slips into the text anyway, the dashboard and the email both detect it and display it as an image.
Some agents never choose their own tools. When an agent is connected only to AWS, BotTrottr fetches the AWS data itself rather than asking the model which tool to call. So for those agents, a chart request (“chart”, “graph”, “plot”, “visualize” plus SES or cost) triggers the chart step directly. You don’t have to phrase anything specially.
Ask for one
- “Produce a chart for today’s SES usage.”
- “Graph my AWS spend this month.”
- On a scheduled agent, add “include a chart” to the task and the chart lands in every result email.
Charts that arrive in your inbox every morning, drawn from live data, with no dashboard to open — that’s the point.
A note on cost data
Cost charts and totals come from AWS Cost Explorer, which needs the ce:GetCostAndUsage permission on the AWS key you saved under MCP Credentials, and Cost Explorer enabled in your Billing console. AWS may lag a day behind on the most recent spend.